

Steve Anaka
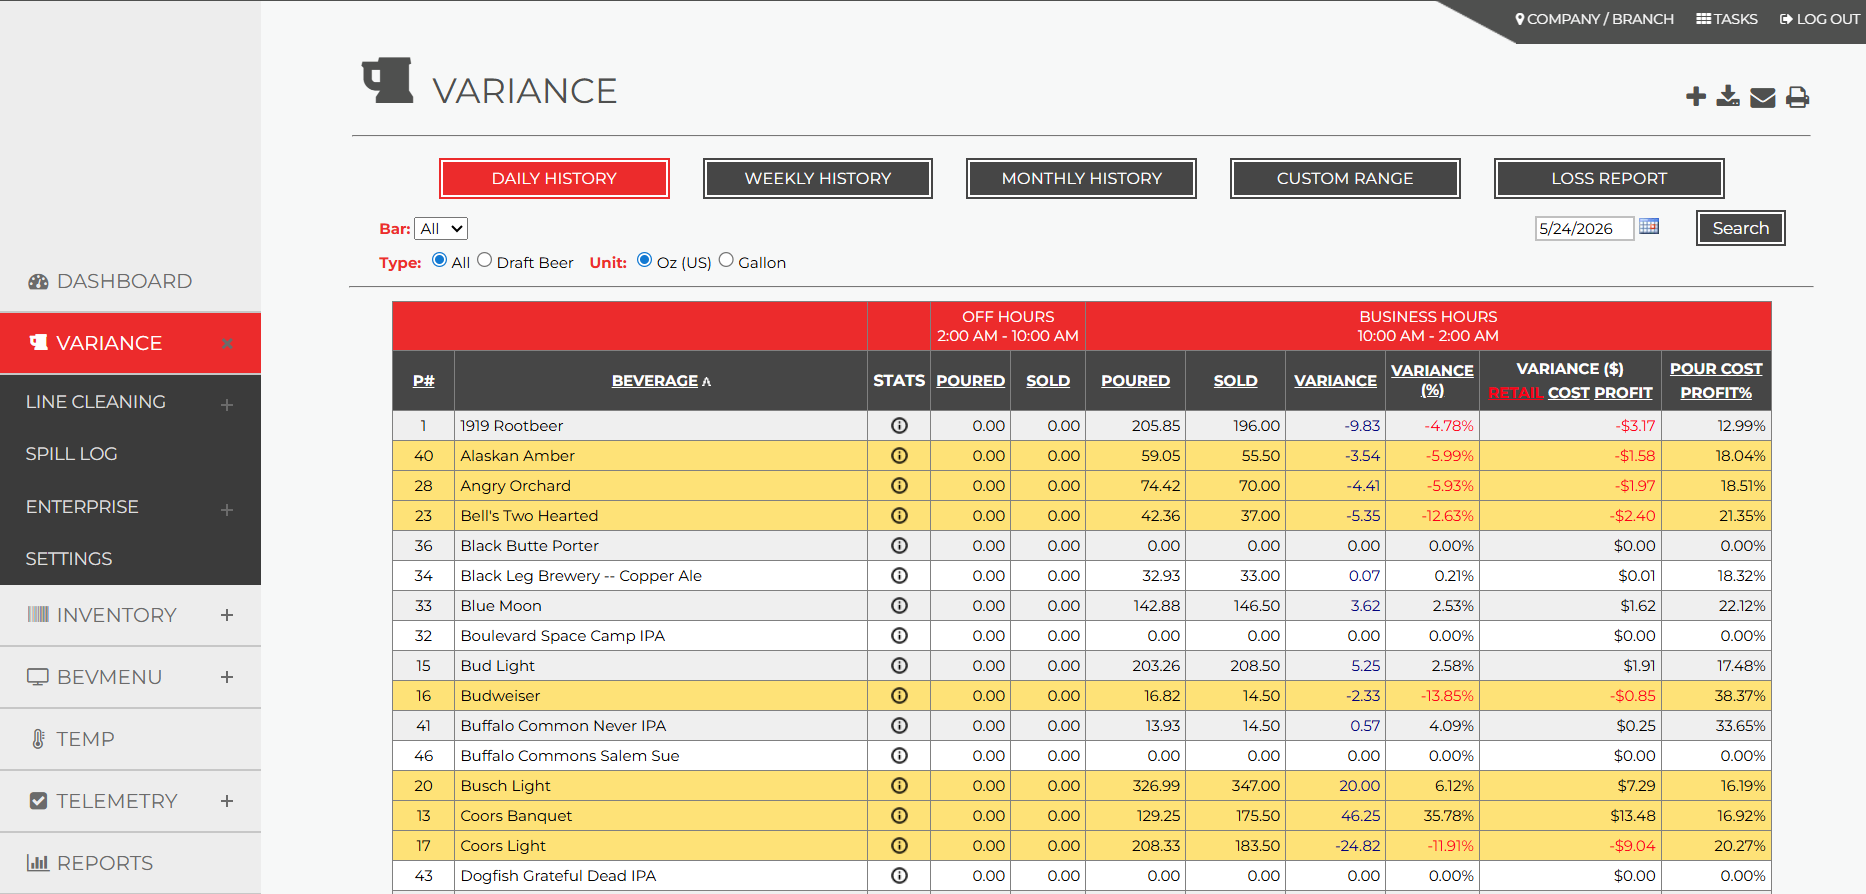
You don’t need Bevchek’s data to start this math — you need three numbers you likely already have, plus one your system would tell you.
Step 1: Know your draft volume. How many kegs (or barrels) does your draft program move in a typical month? This is usually sitting in a distributor invoice or POS report already.
Step 2: Know your keg cost. What’s the average landed cost per keg across your draft lineup? A blended average across your top-selling drafts works fine for a rough estimate.
Step 3: Estimate your current loss rate — or find out. This is the number monitoring actually answers. Until you have it, you can build a conservative range using your own inventory variance history (the gap between what you ordered and what your POS says you sold is a rough proxy, even if it’s an imperfect one).
Step 4: Multiply. Monthly keg volume × keg cost × loss rate = your estimated monthly draft loss. Multiply by 12 for an annual figure.
Even a modest loss rate, applied across a full year of draft volume, tends to land on a number large enough to change how “we’ll get to it eventually” sounds in a budget conversation.
The Part the Math Above Misses
That calculation only captures product loss — the beer that’s gone. It doesn’t include the costs that don’t show up in a keg invoice:
- Labor spent investigating discrepancies. Every hour a manager spends trying to explain a bad inventory count is an hour not spent running the floor.
- Customer dissatisfaction from inconsistent pours. A foamy or flat pint doesn’t show up as a line item, but it shows up in repeat visits and reviews.
- Reactive maintenance costs. Equipment problems caught late tend to cost more to fix than the same problem caught early.
- Opportunity cost of slow decisions. Without real usage data, purchasing and keg rotation decisions default to habit instead of what the numbers actually support.
None of these are easy to put a precise number on, which is exactly why they get left out of most loss conversations — but they’re real costs sitting on top of the product loss number above.
What “Paying for Itself” Actually Looks Like
The ROI case for monitoring isn’t about squeezing out every last ounce of efficiency. It’s about the gap between an unmeasured loss rate and a measured, actively managed one. Most operators who put real numbers to this exercise find that even a partial reduction in draft loss — catching problems weeks earlier instead of finding them at count time — covers the cost of monitoring well before the end of the year, with everything after that landing as margin.
The uncomfortable part of this exercise isn’t the math. It’s realizing that the “cost” of not monitoring was never zero — it was just invisible.
Put Real Numbers Behind the Guess
Bevchek replaces the loss-rate guess in that formula with an actual, measured number — so instead of estimating what draft loss might be costing you, you know, and you can act on it before it adds up.
Want to see what the real numbers look like for your venue? Schedule a demo.